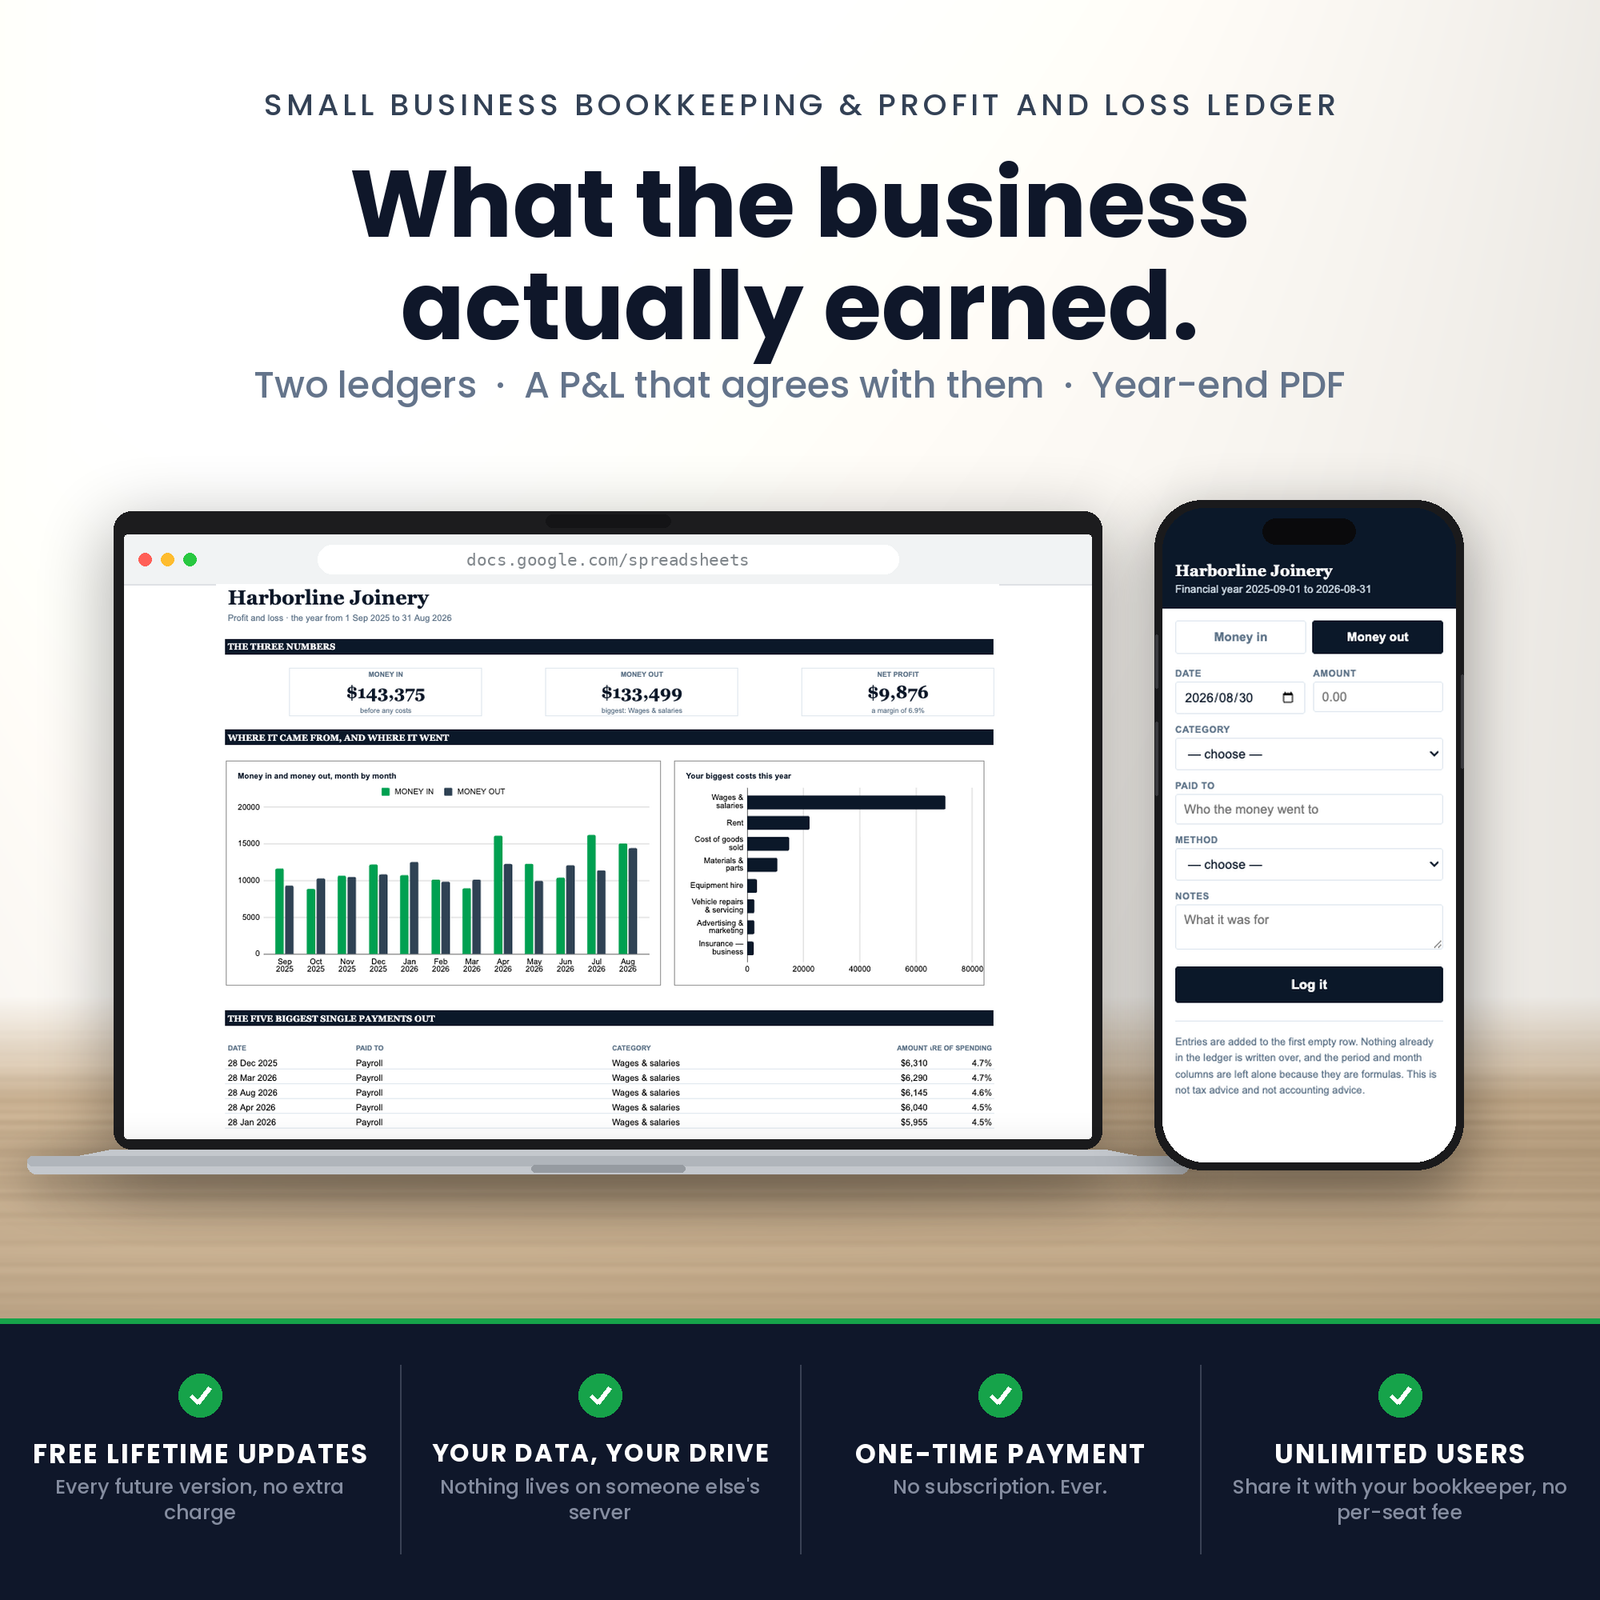
This is a small business bookkeeping spreadsheet with two ledgers and a profit and loss that agrees with them — the answer to what did the business actually earn?
What you are buying
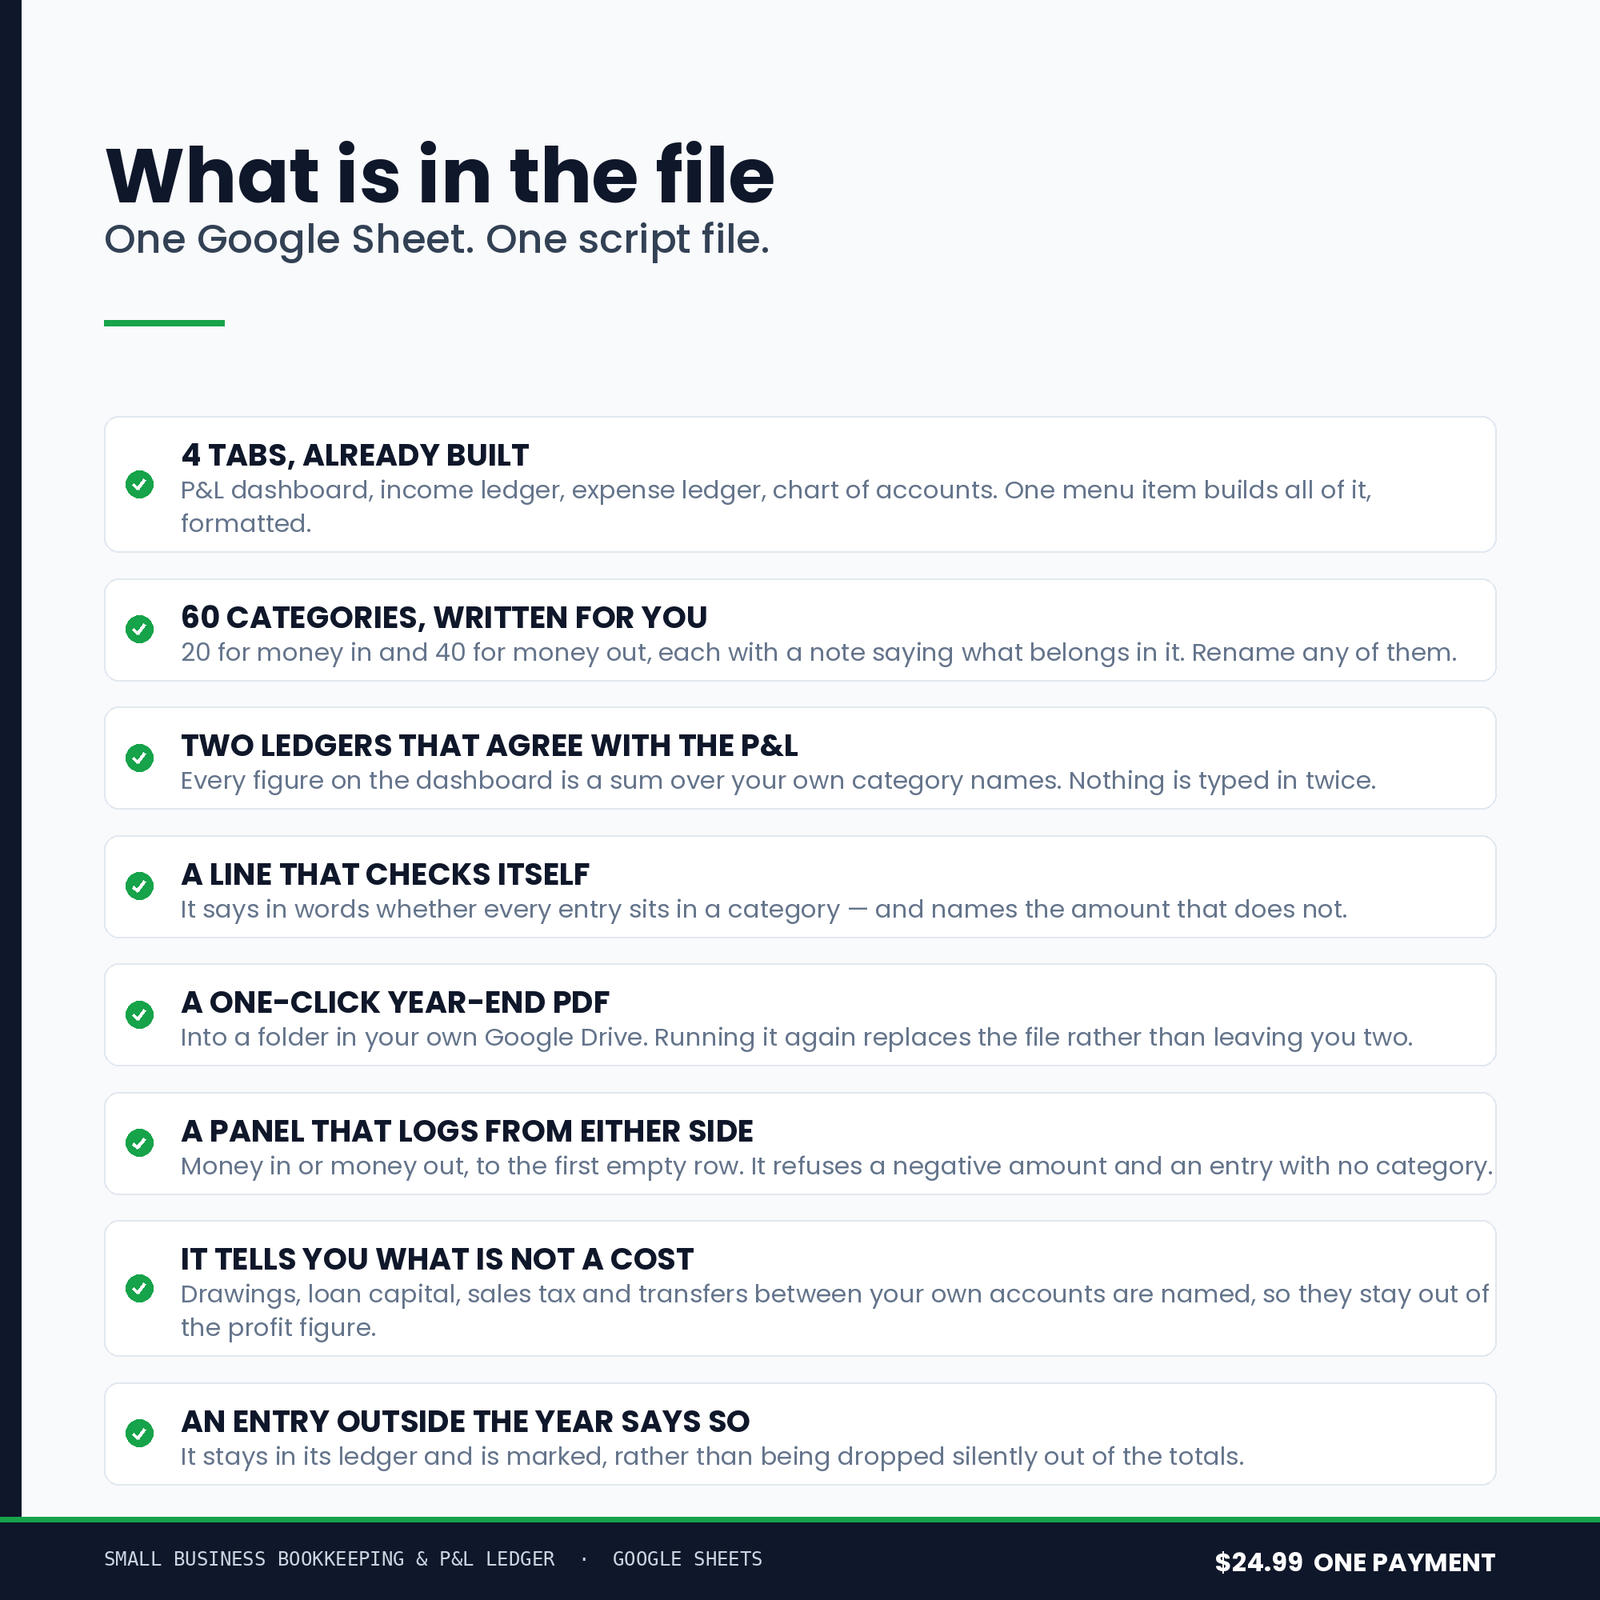
One Google Sheet, copied into your own Drive from a link. Four tabs, built for you in a single run, with two charts and a one-click Year-End Profit & Loss PDF into your own Drive.
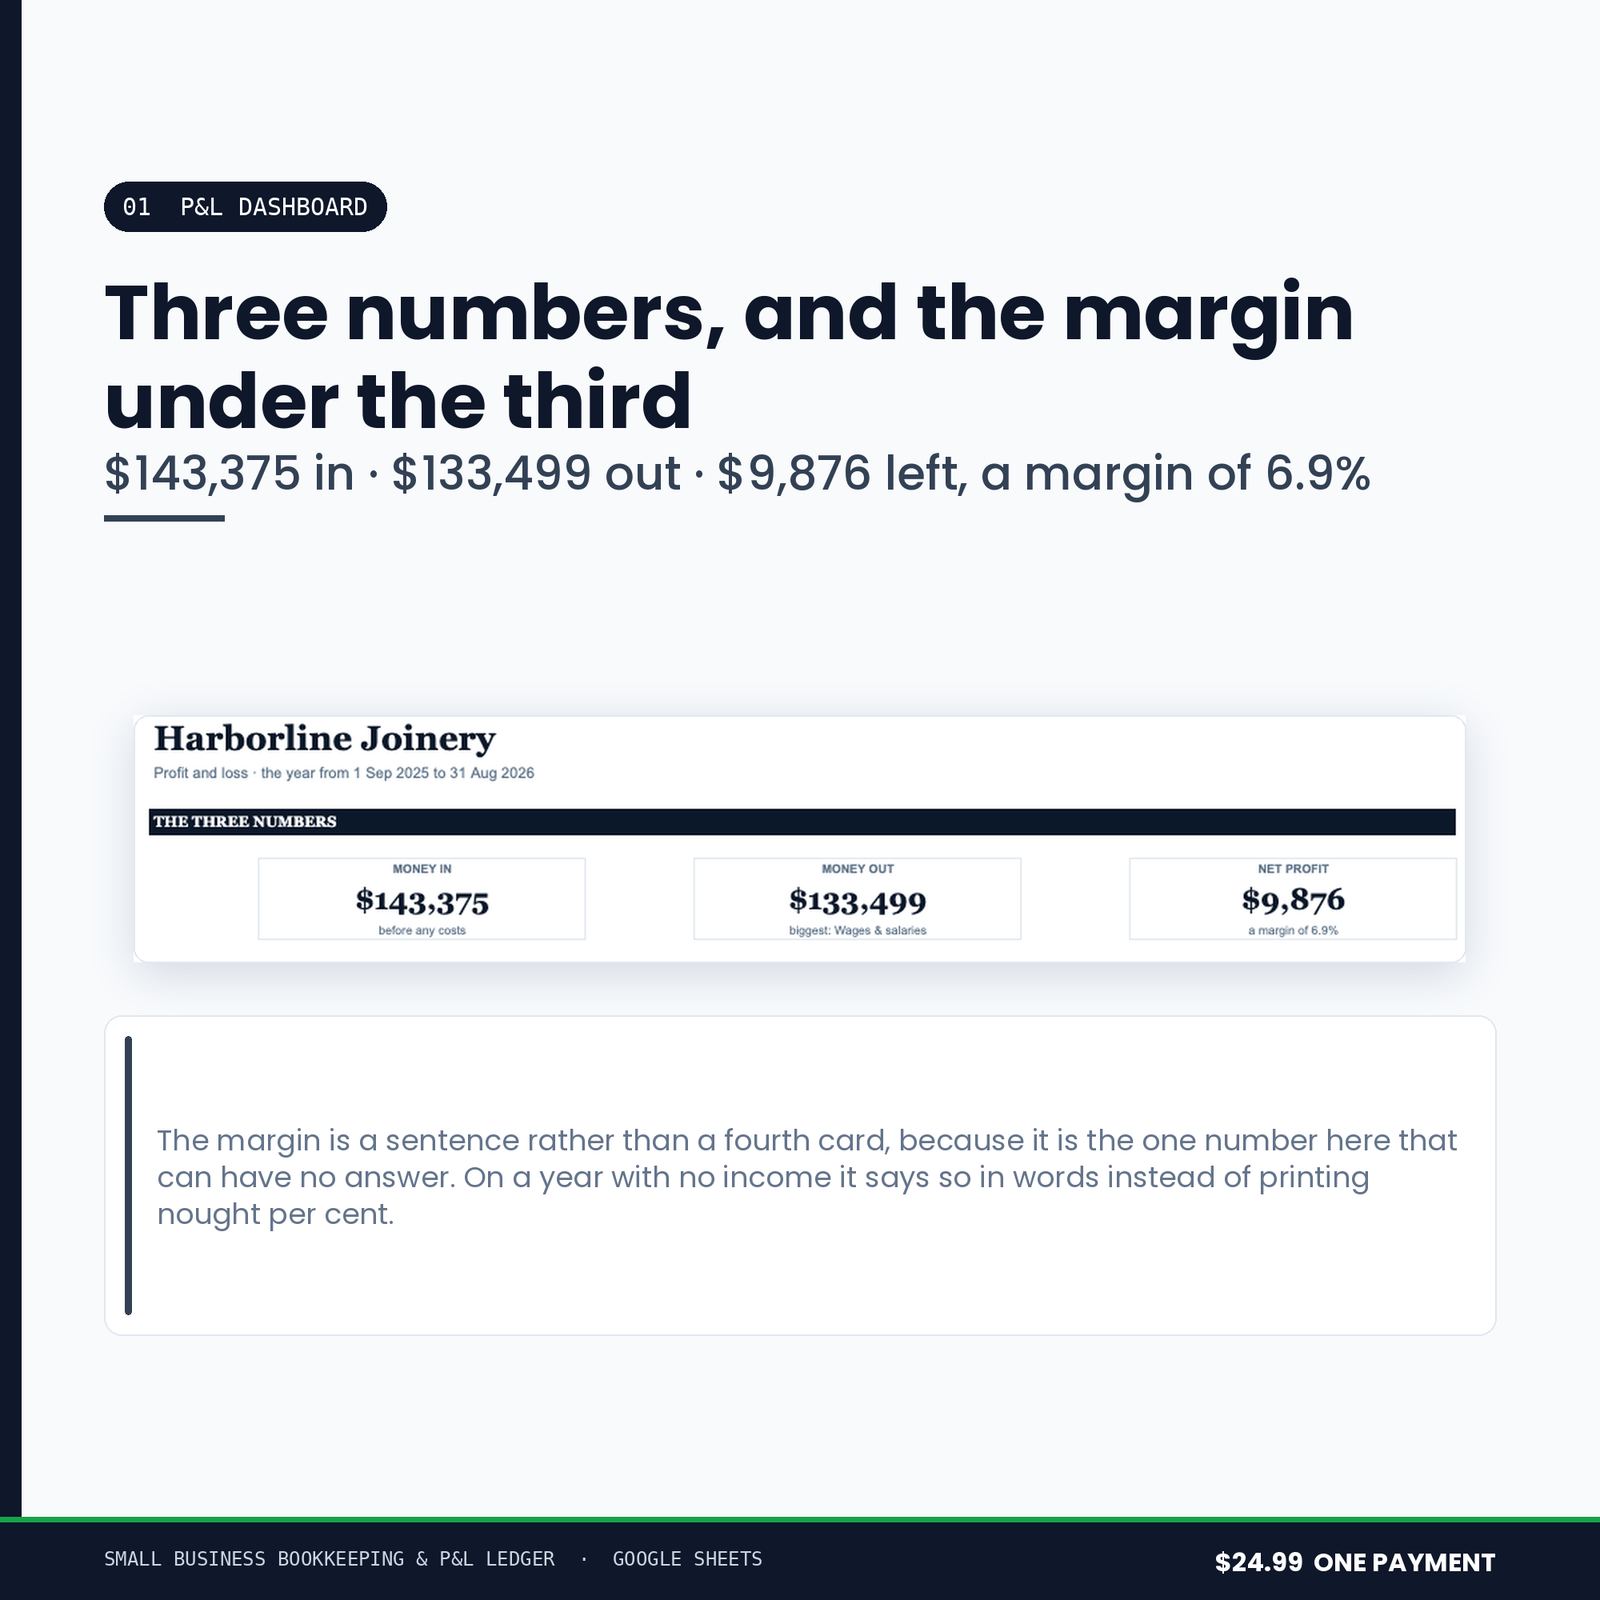
- 01 P&L Dashboard — income, costs, profit and margin, with the two charts underneath
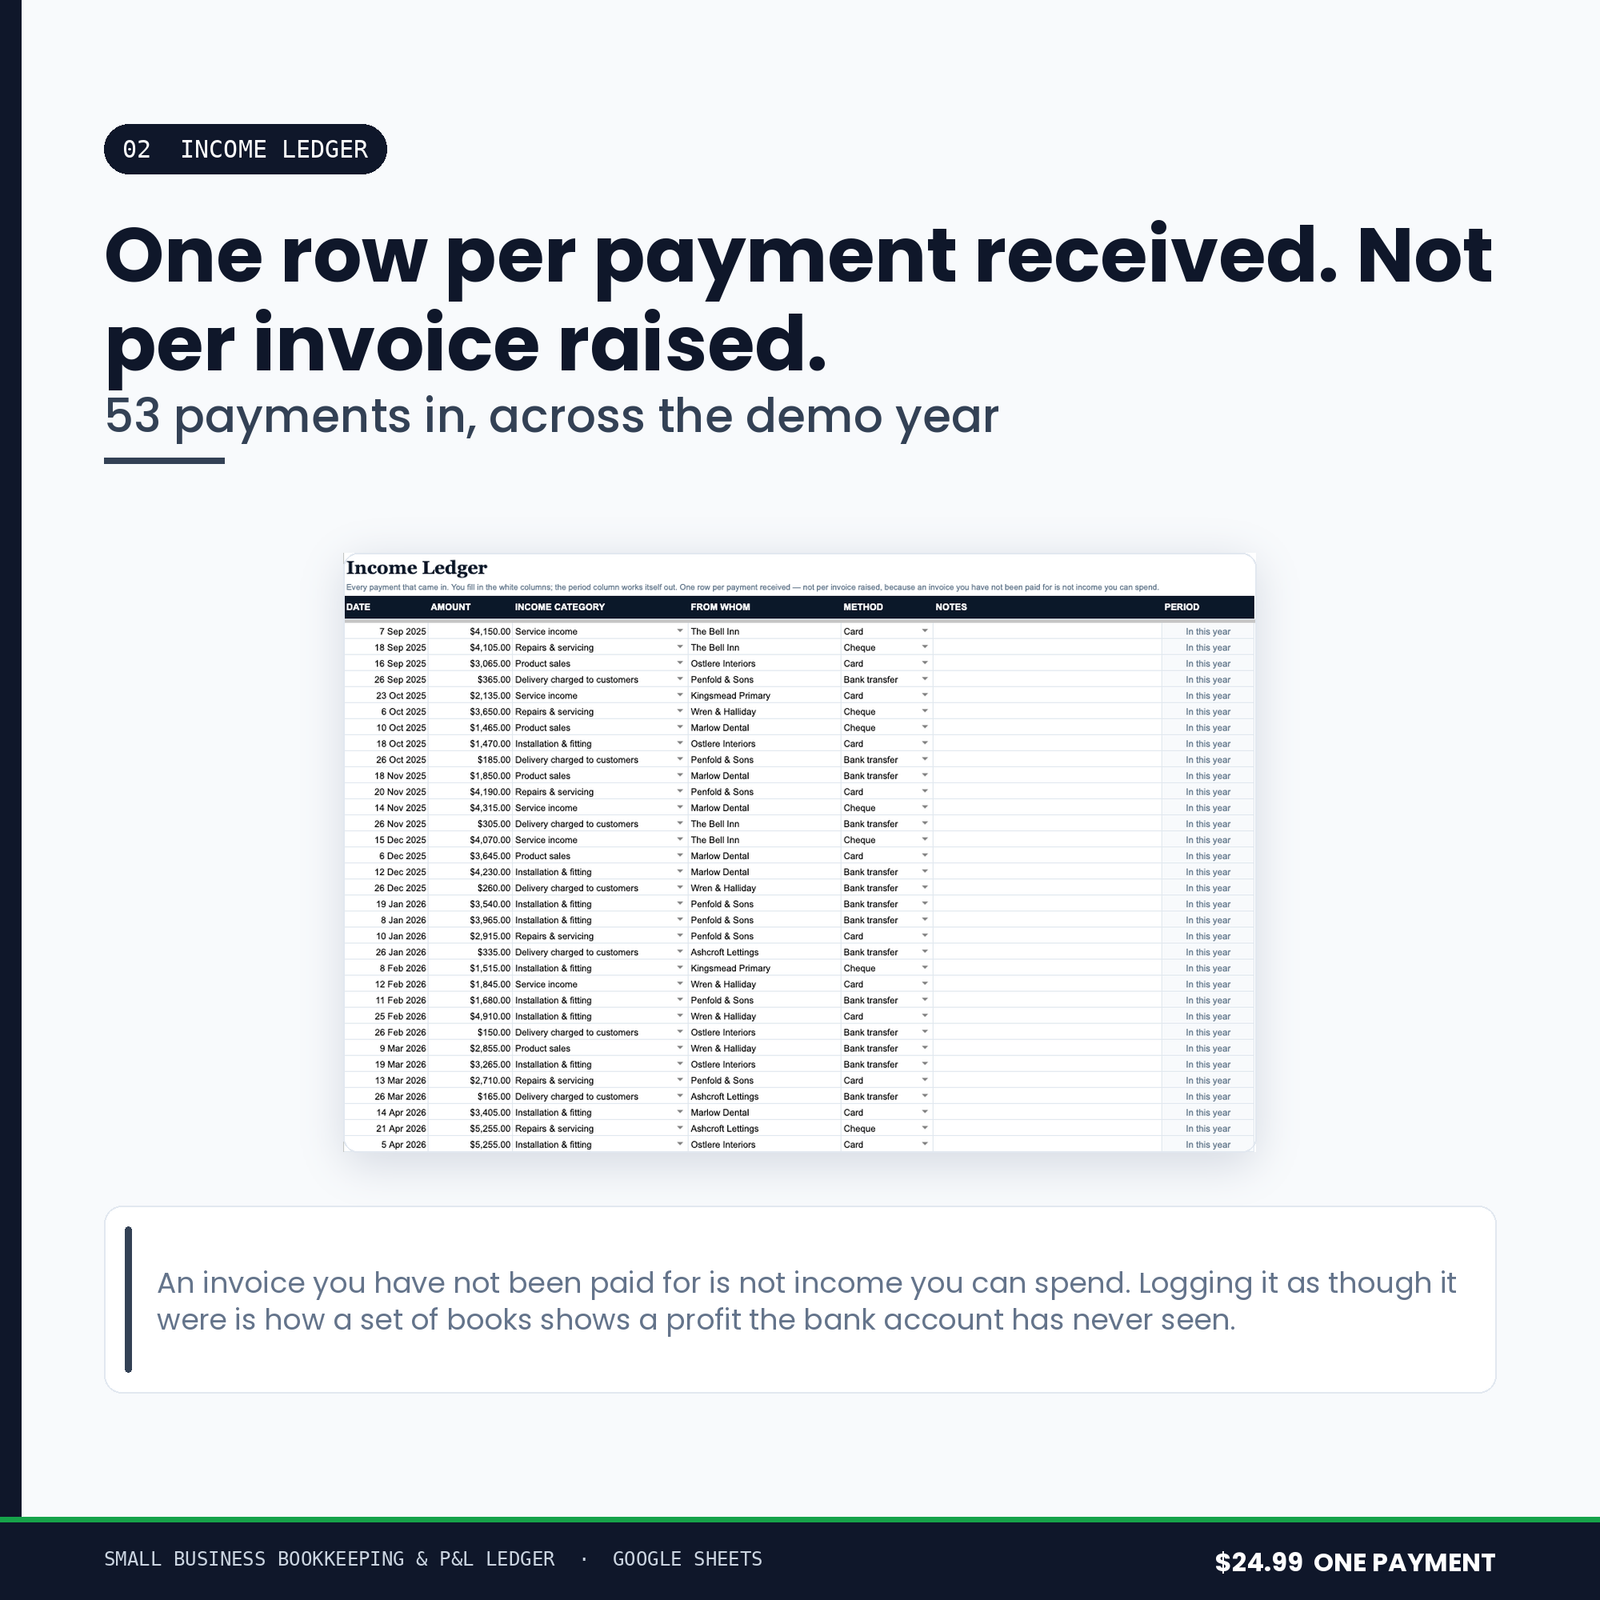
- 02 Income Ledger — a thousand rows of money in
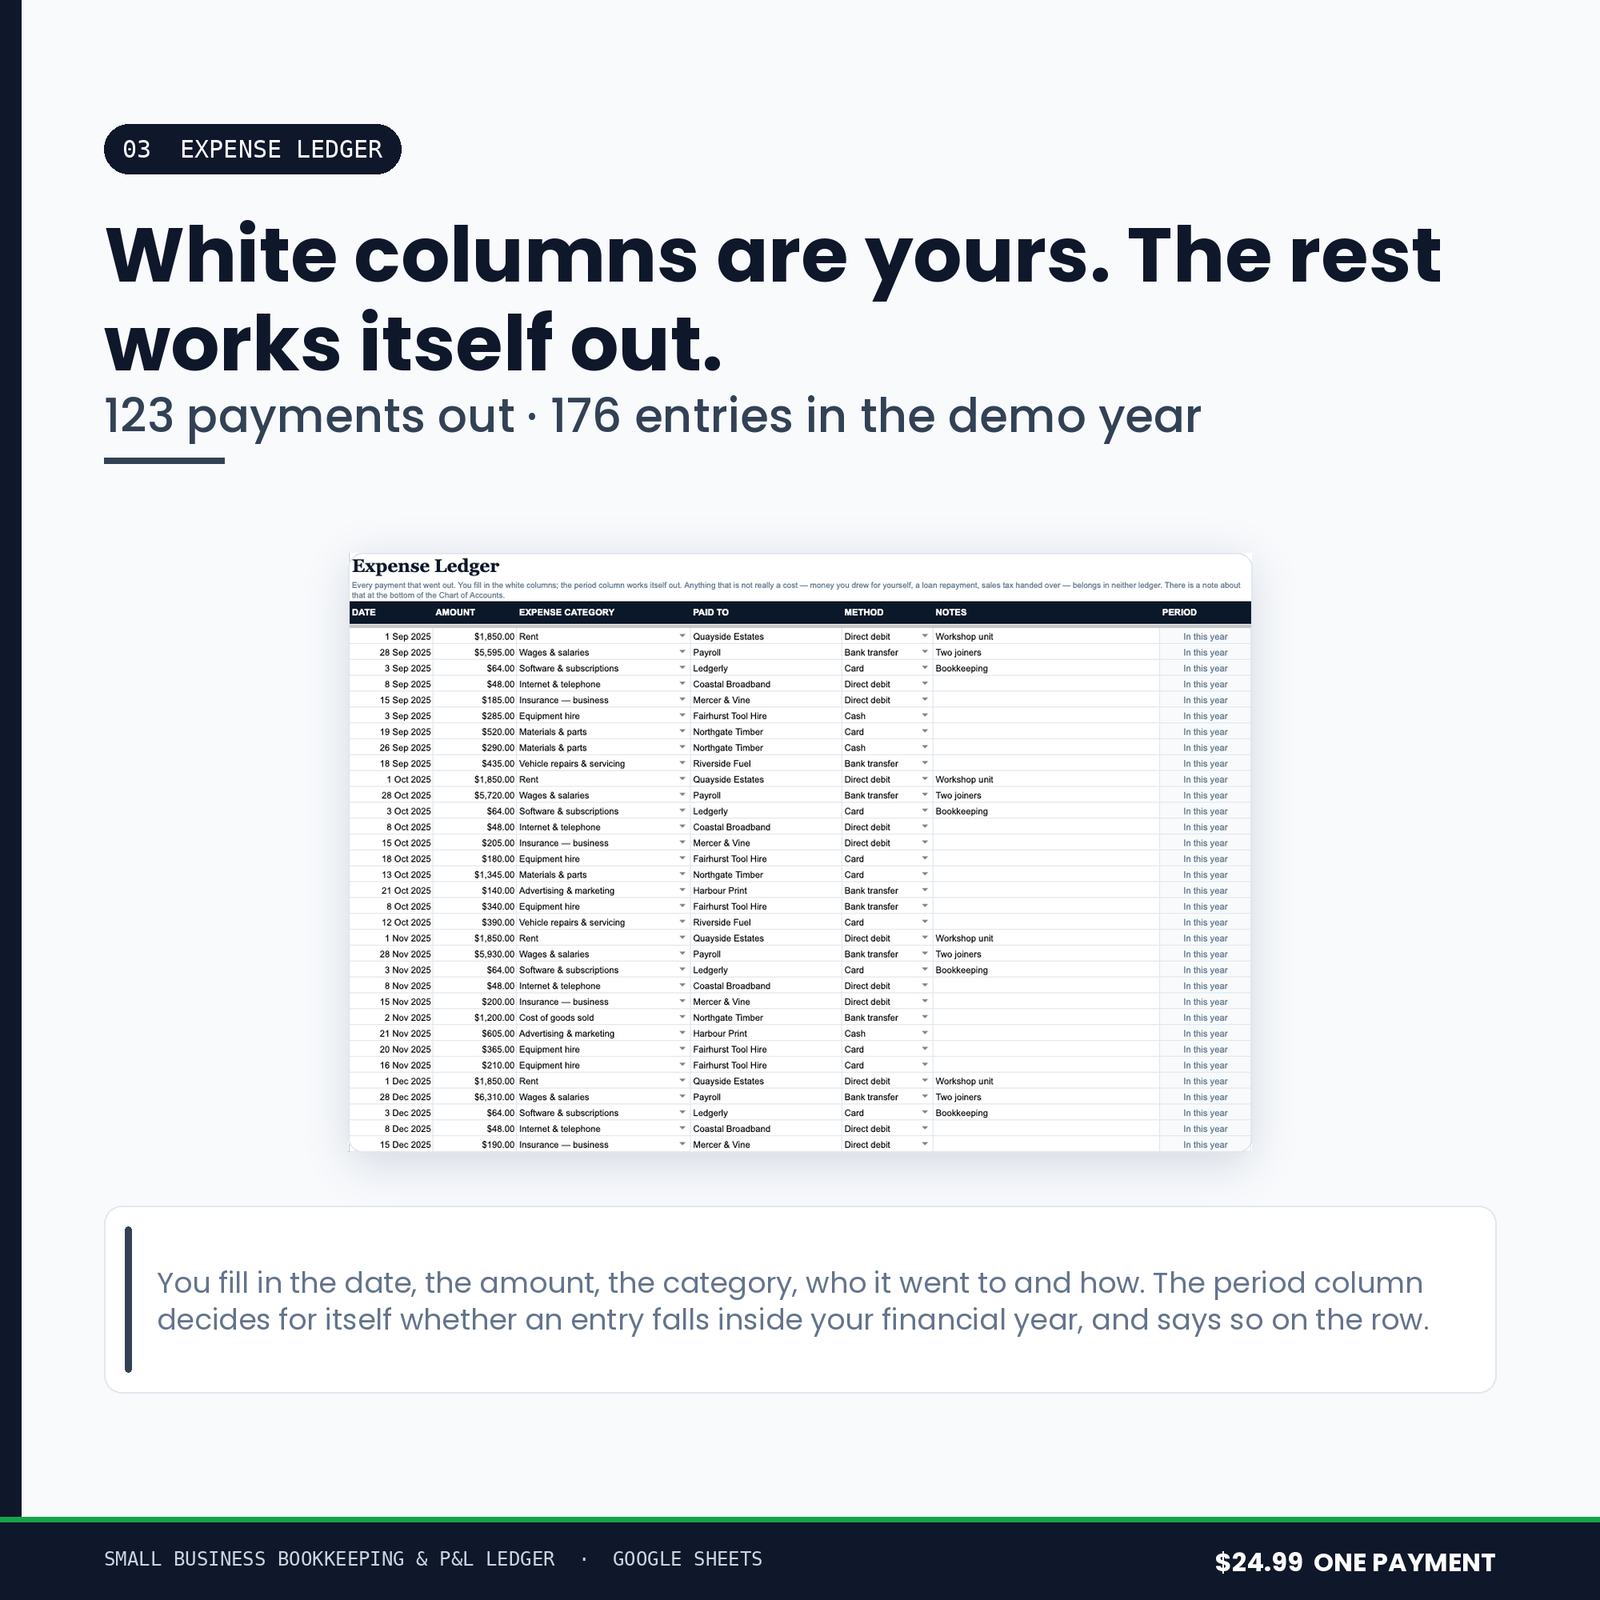
- 03 Expense Ledger — a thousand rows of money out
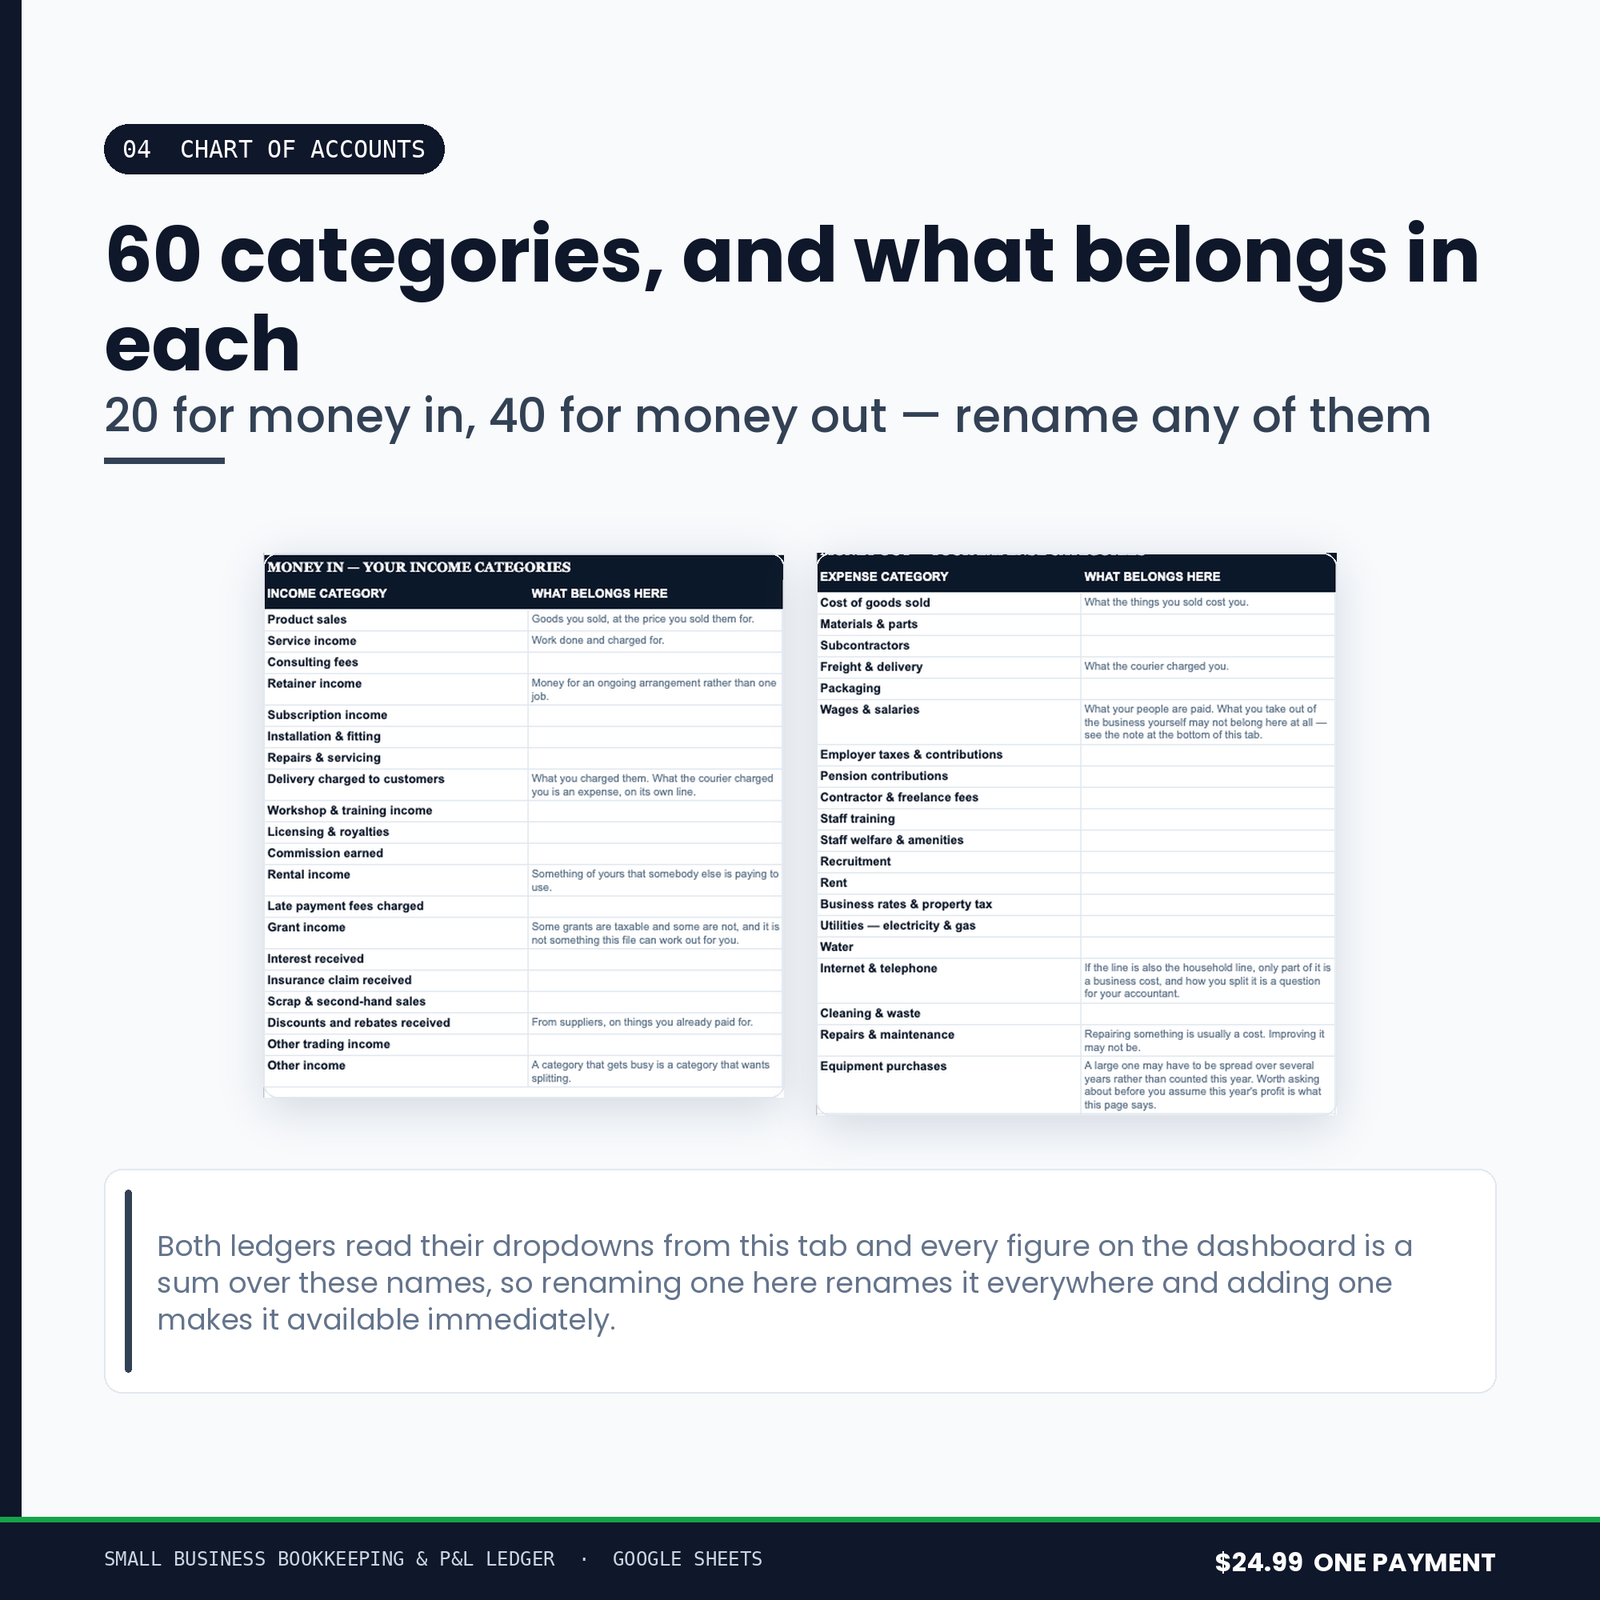
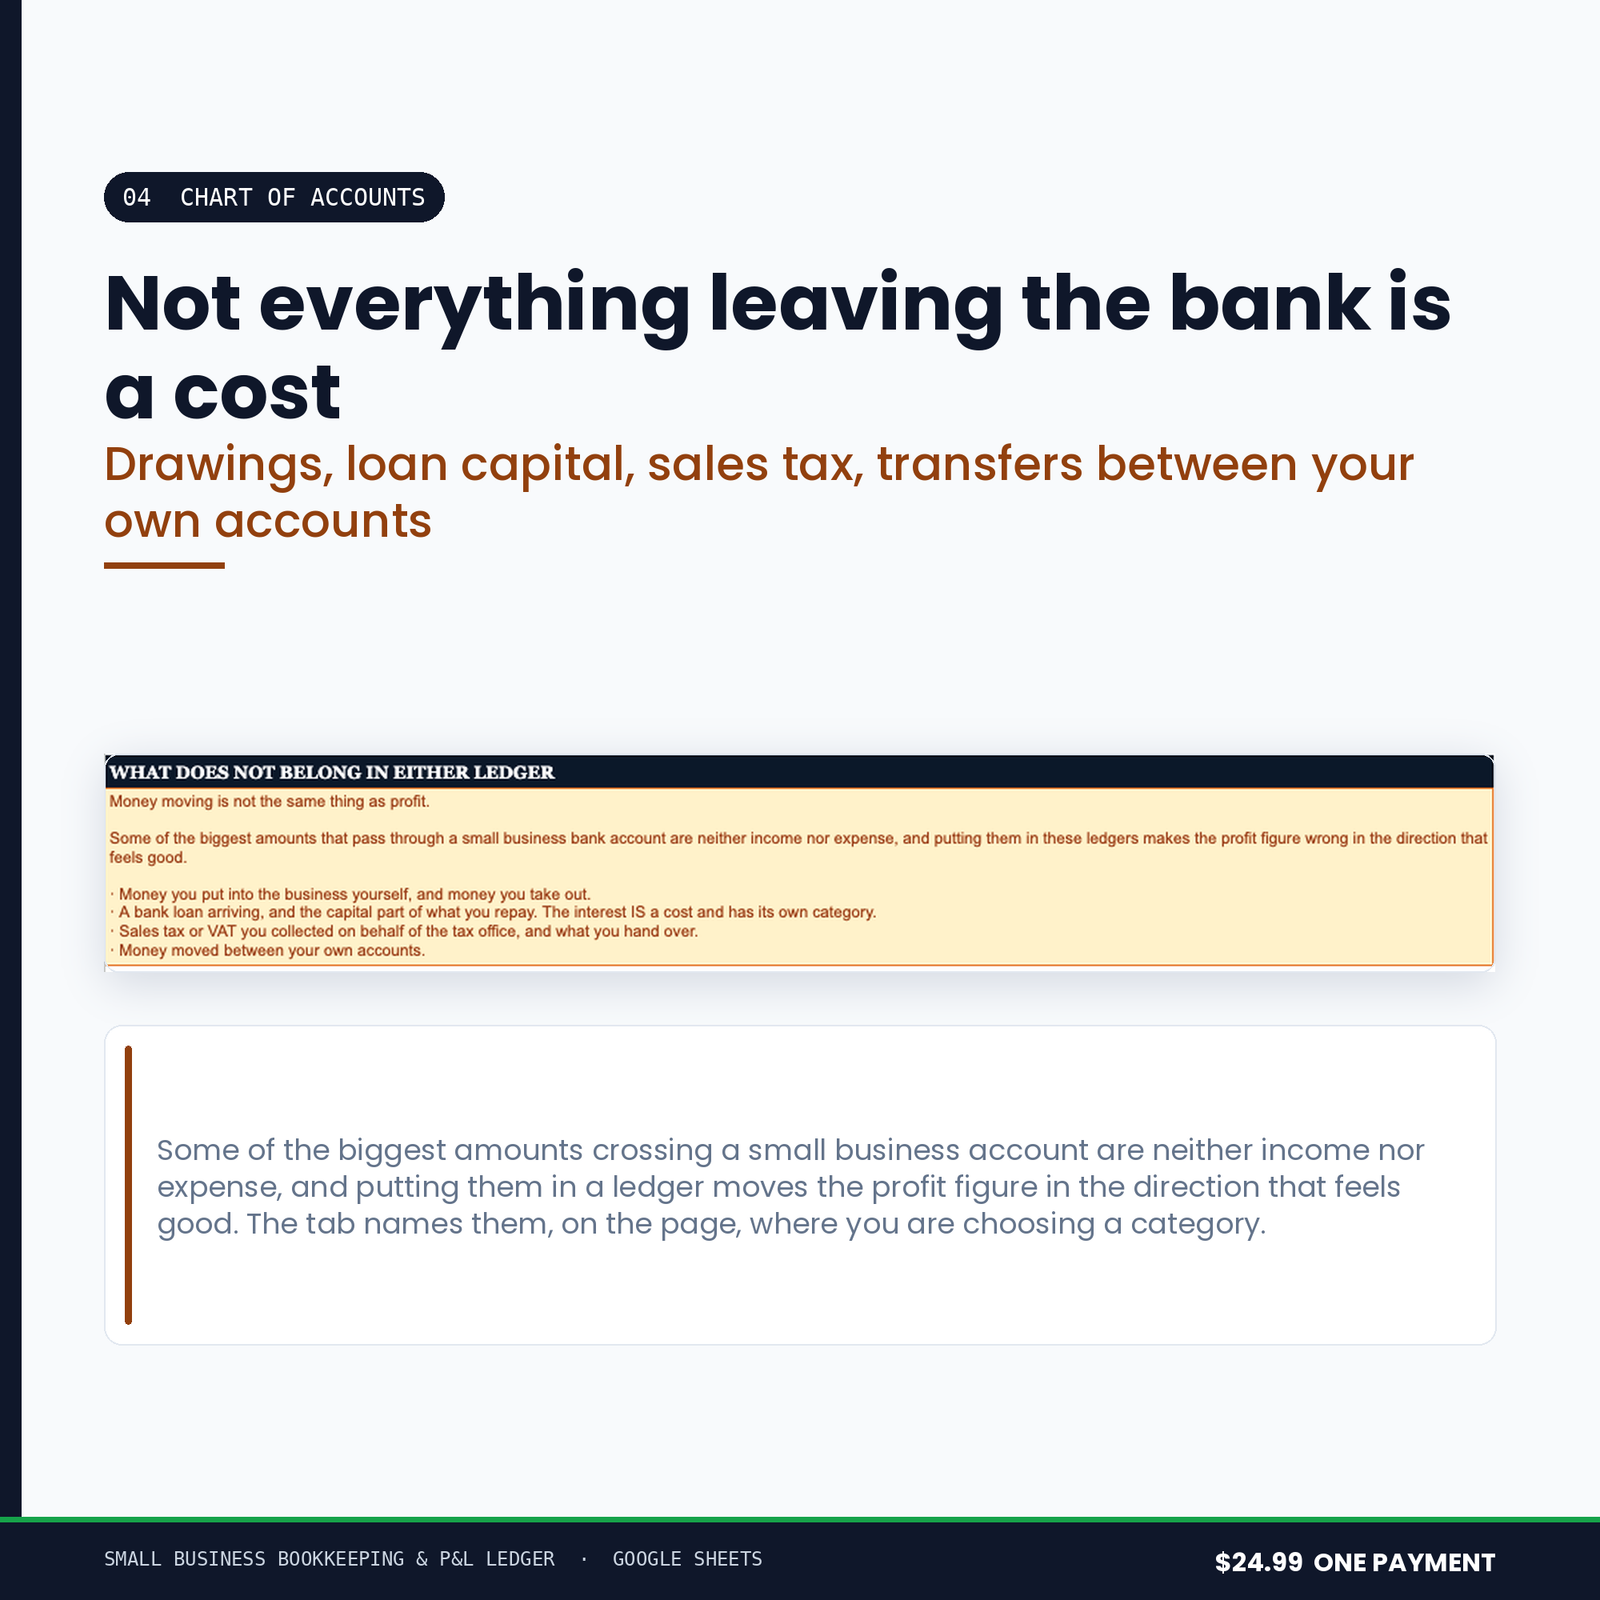
- 04 Chart of Accounts — your categories — yours, not anybody else’s
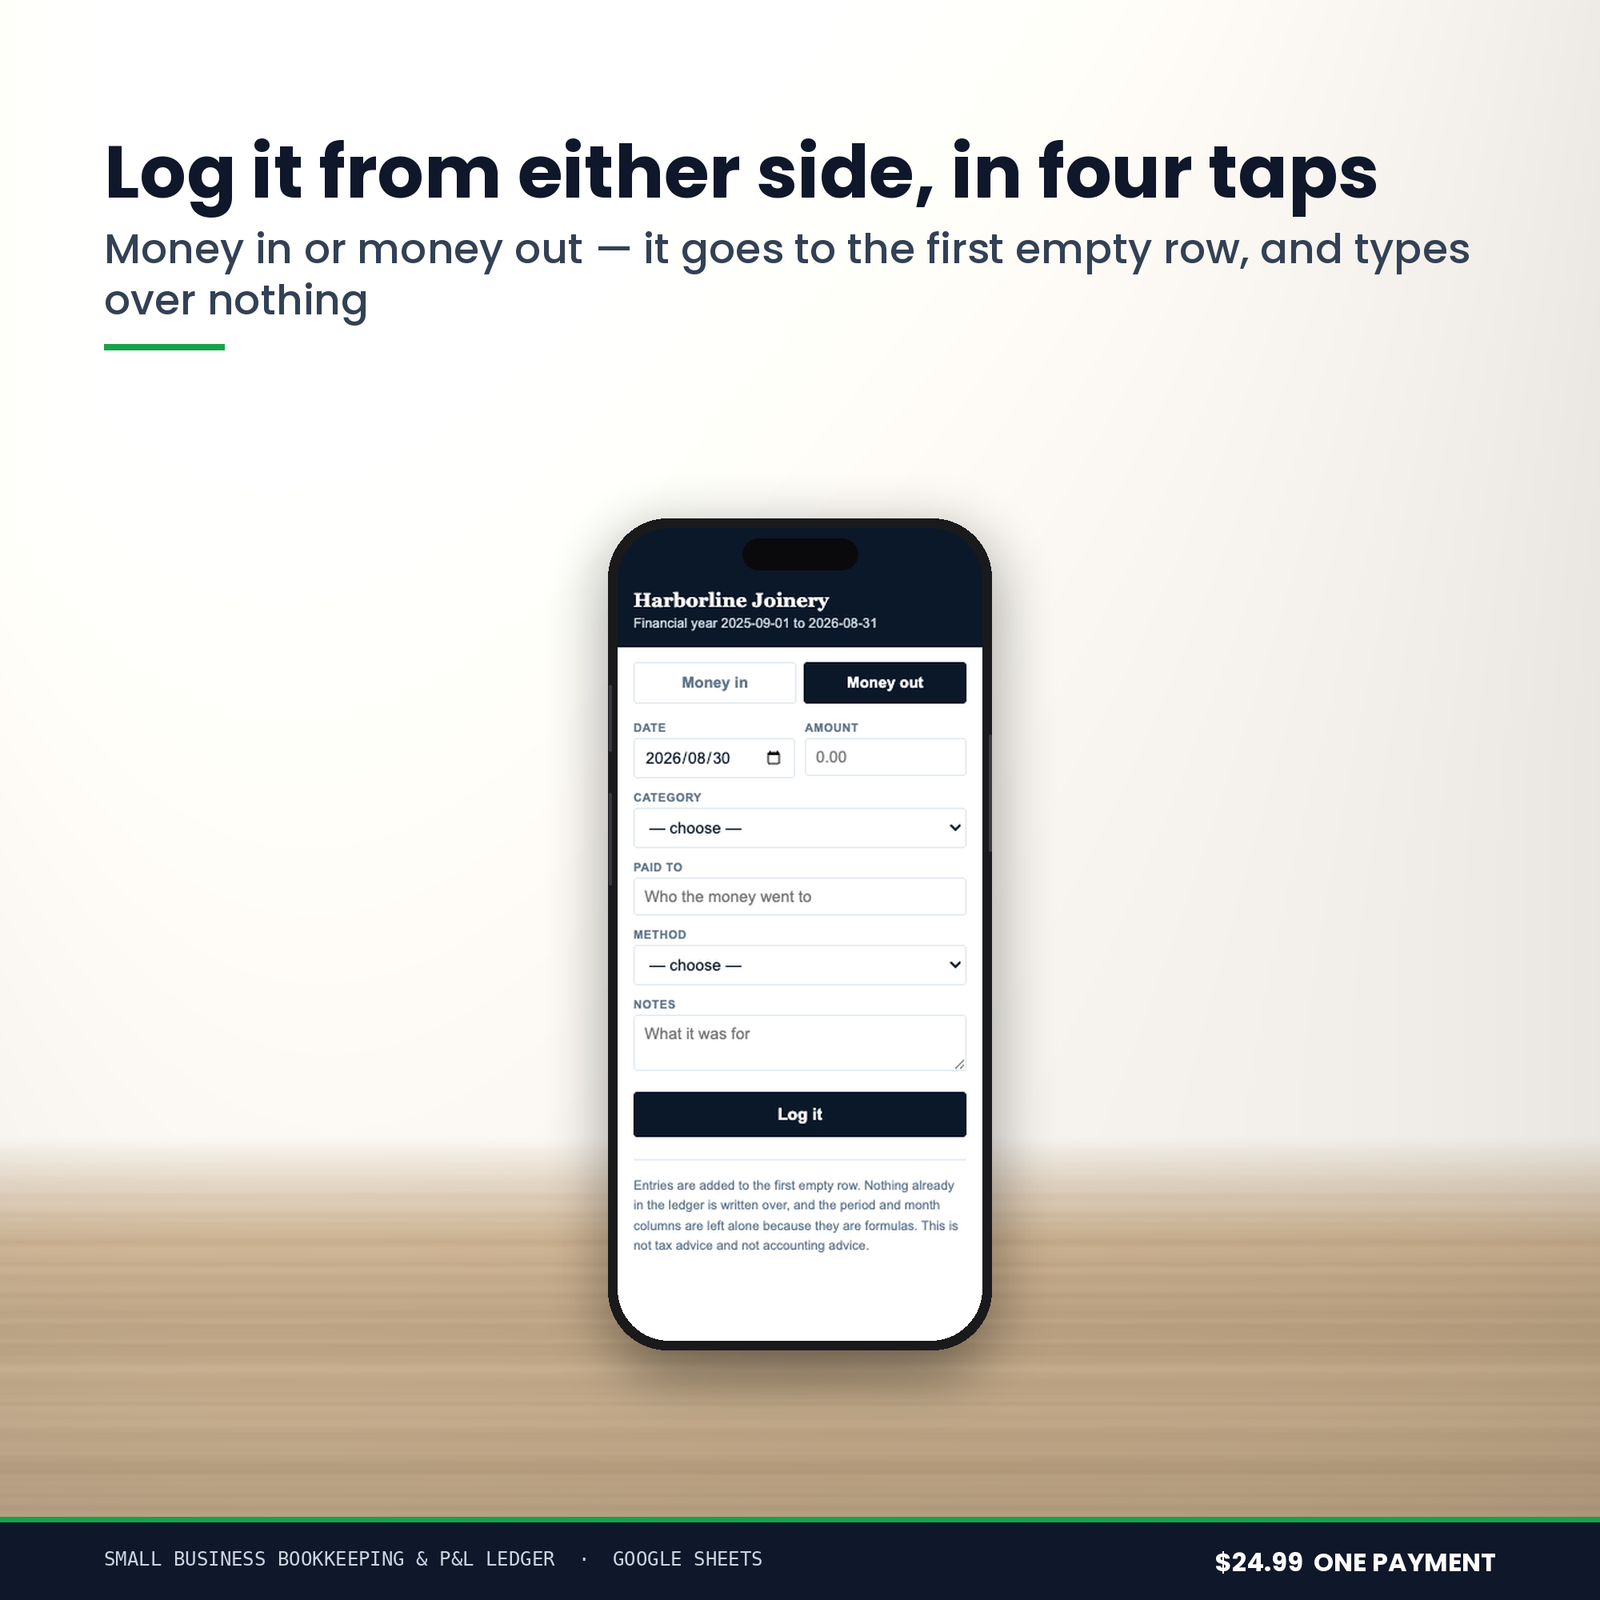
Plus a Log Money In or Out panel built into the workbook itself.
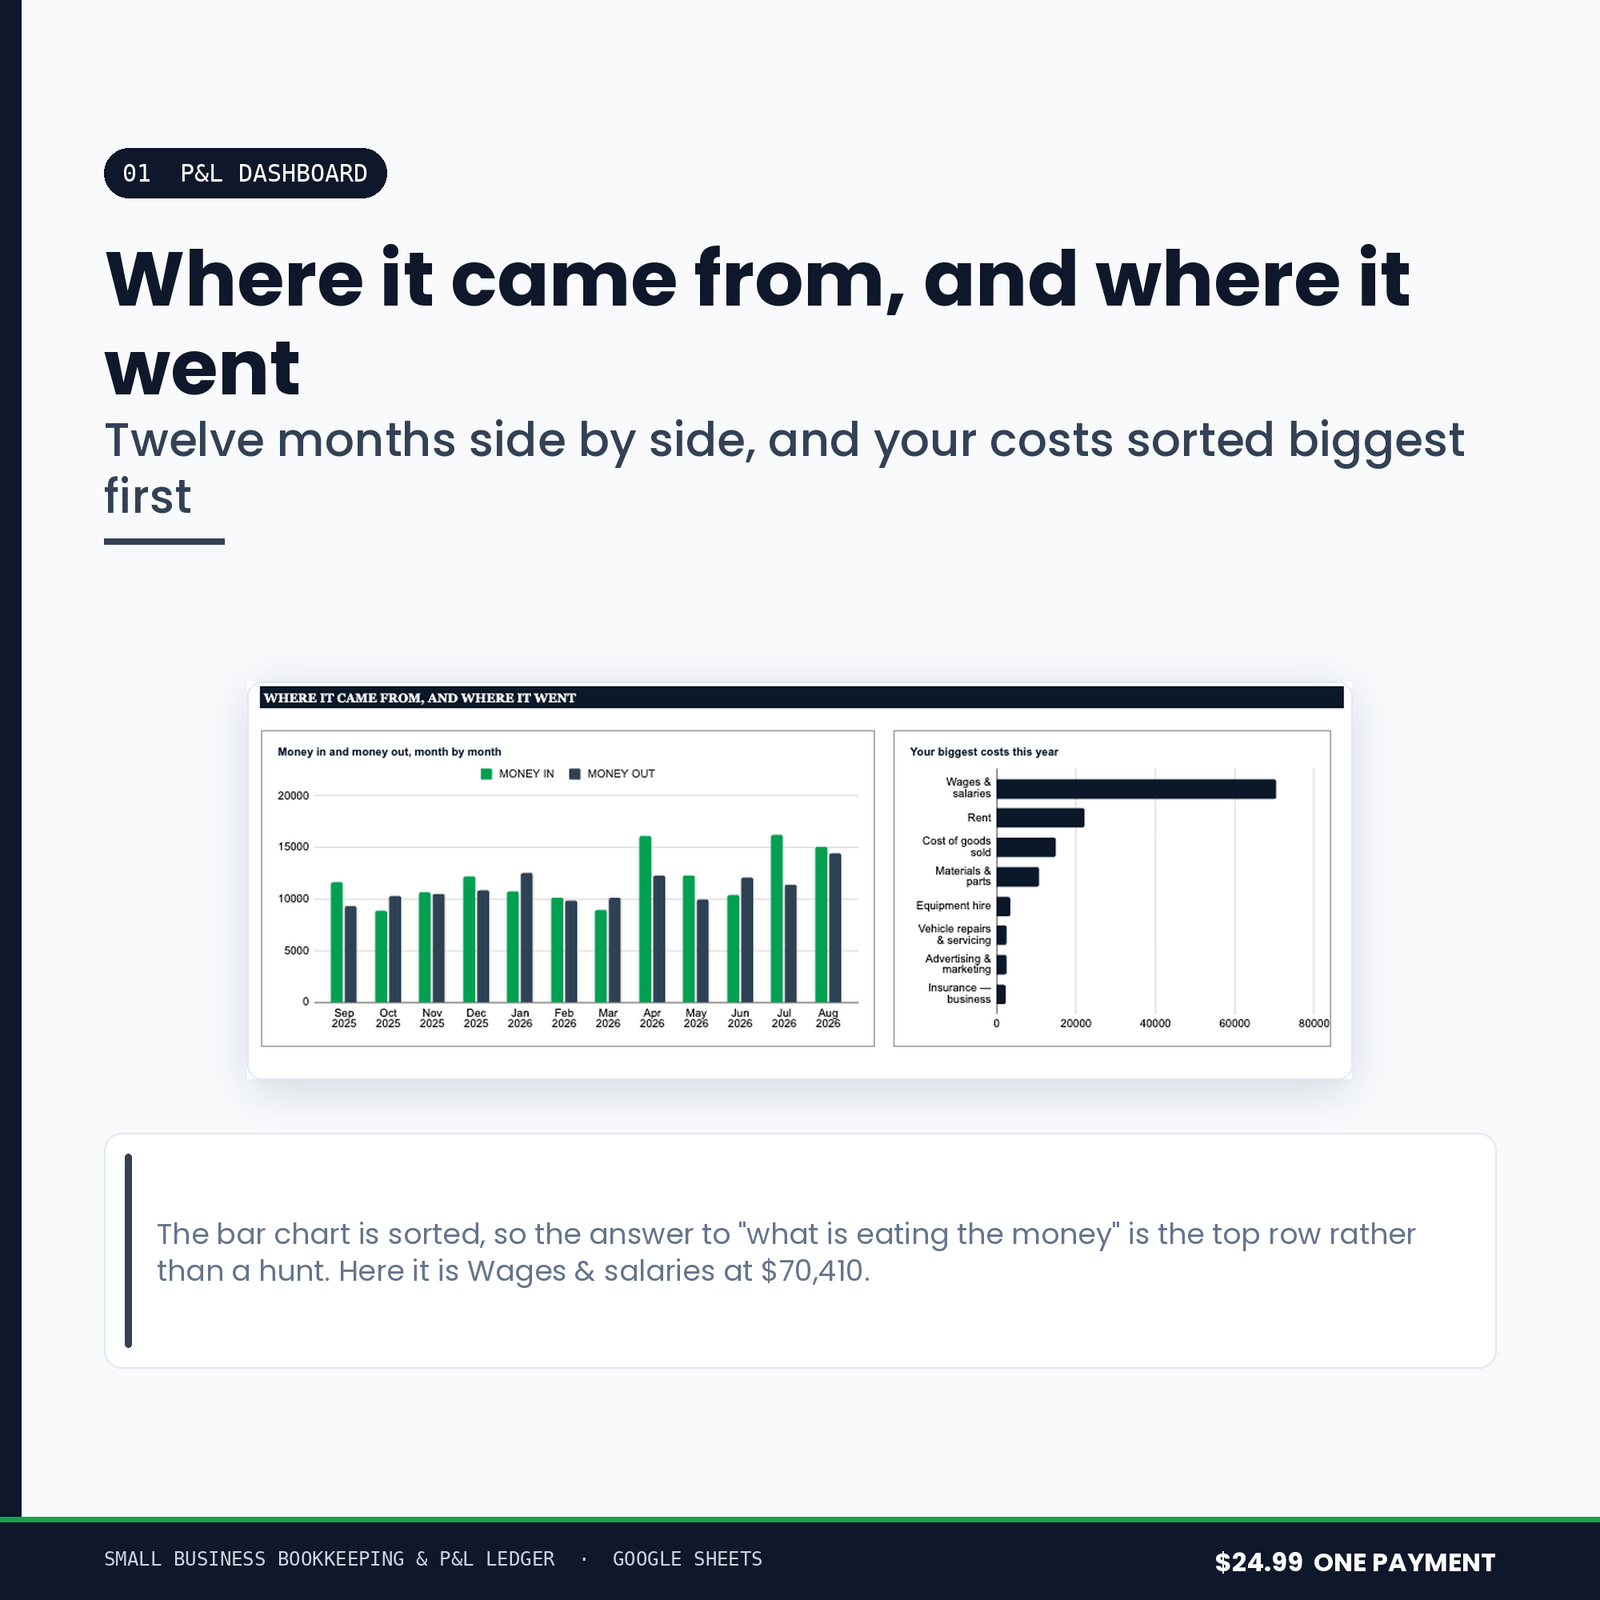
The charts:
- Money in and money out, month by month — a column chart.
- Your biggest costs this year — a bar chart, sorted, so the answer is the top row rather than a hunt.
What it refuses to do
Anyone can add up a column. This is the list that took the time.
The page says so when it stops adding up.
The three numbers count every entry dated inside your year. Both charts are sums over your category list, so an entry filed under a name that is not on it is invisible to them and the totals and the pictures stop agreeing. The line at the bottom compares the two and prints the gap in words — because a category renamed after it was used, or listed twice, is the failure that costs you an evening in April.
An entry dated in the wrong year is greyed out, not dropped.
Type 2025 when you meant 2026 and the row goes grey and says why. The alternative is an entry that vanishes from the P&L and stays in the ledger, and a total nobody can reconcile.
No margin of zero per cent on no income.
Nothing divided by nothing is not zero. It is an em dash.
It does not claim your categories are approved by anybody.
They are the categories you typed. This is a ledger, not a tax filing, and it says so on its own dashboard.
Nothing in this suite can email anyone
Not one of these five tools requests a Gmail permission of any kind. That is a stronger promise than a line in a description saying it would never do such a thing: it could not email your customer, your supplier or your accountant if a future version tried, because the permission to do it was never asked for.
Drive access is drive.file — only files the script itself creates. It cannot see the rest of your Drive. Your figures stay in your own Google account.
From purchase to working, in about fifteen minutes
You get a link and an 11-page PDF setup manual. Press the link, and Google makes you your own copy of the workbook — there is no account to create, no add-on to install and nothing to paste into a script editor.
Open your copy, run ⚡ Books OS → Setup → 1. Build / Rebuild Workbook, and it constructs every tab, formula, border and the chart itself. You format nothing. Then run Setup → Load Demo Year and look at it working on an invented business before you type a figure of your own — one menu item erases the demo again and leaves every formula in place.
Most of the fifteen minutes is you reading the two category lists, which is the part worth reading — sixty names, each with a note on what belongs in it. The manual walks all of it, and lists the permissions Google will ask for with a written reason for each one.
What you need
A free Google account. It runs on Google Apps Script, so it will not work in Excel, Numbers or LibreOffice — said here rather than in a refund email.
Buying more than one
All five tools in this range are sold together as the Small Business Financial Control Suite for $49.99. Bought separately the five come to $104.95.
Before you buy
This is a spreadsheet, not an accountant. It applies no accounting standard, offers no assurance, and is not a substitute for a qualified accountant or bookkeeper. Nothing in it is tax, financial or legal advice, and nothing it produces has been approved by any authority. Every figure it shows is arithmetic on what you typed into it.